Do polls influence election results?
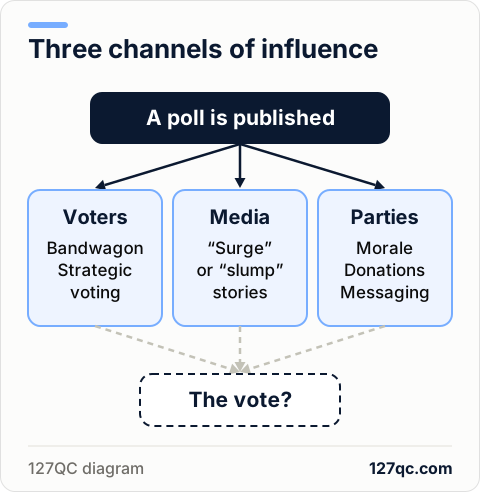
Polls measure voting intentions, but they can also shape perceptions, media coverage and party strategy. Their effect on the ballot itself is harder to pin down.
A party rises in the polls. Commentators talk up its momentum. Its rivals have to explain their slide. This scenario raises a central question: what happens when the measurement of opinion becomes political news in its own right?
Research offers a nuanced answer. Some studies detect an influence on preferences; others find no measurable effect on the vote. These findings do not support the conclusion that polls have a uniform effect in every election.[1][2][3]
The appeal of a rising party
The “bandwagon effect” is the possibility that a party gains support because it looks popular or appears to be gaining ground. The “underdog effect” suggests the opposite: a party that is slipping wins support out of sympathy.
In an experiment published in 2016, Jens Olav Dahlgaard and colleagues found that showing a party rising in the polls could increase people’s intention to vote for it. They found no evidence of an underdog effect.[1] A study of three British elections reached similar conclusions.[2]
These findings do not mean that voters blindly follow the leader. The size of an effect observed in one context does not automatically carry over to a Quebec campaign.
When the numbers fuel strategic voting
Someone may prefer one party but vote for another that they see as better placed to defeat their main opponent. The British study suggests that polls can make this kind of tactical voting easier, especially when three parties are competitive.[2]
Take a fictional example: a voter prefers party A, but believes the local race is mainly between B and C. If her priority is to keep C from winning, she may choose B. Her perception of the candidates’ chances shapes her decision, without her convictions necessarily changing.
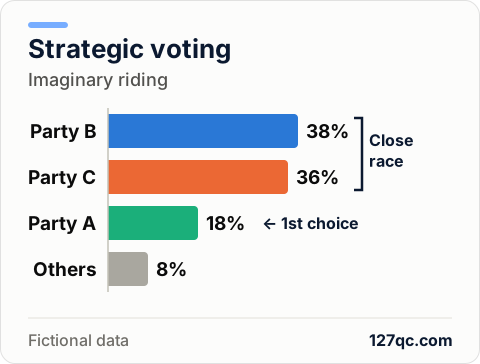
In Quebec, however, the province-wide picture and the local race need to be kept apart. A party that is third across Quebec can be competitive in a given riding. And a local projection calculated by a model is not a poll of that riding’s voters.
What Canadian research shows
During the 2015 federal election, André Blais and colleagues ran an experiment with people whose first choice ranked third or lower in their riding and whose second choice was one of the top two. Participants were randomly given information on estimated local support, national support, or no additional information.
The experiment found no increase in strategic voting attributable to this information.[3] That does not prove polls never influence anyone; it shows that one specific intervention produced no detectable effect.
In a 2023 opinion piece, Jean-François Daoust, Claire Durand, Mélyann Guévremont and André Blais also note that people who follow polls are more likely to vote.[4] This association does not show that polls mobilize them: an interest in politics may drive both behaviours.
Media narratives and campaign teams
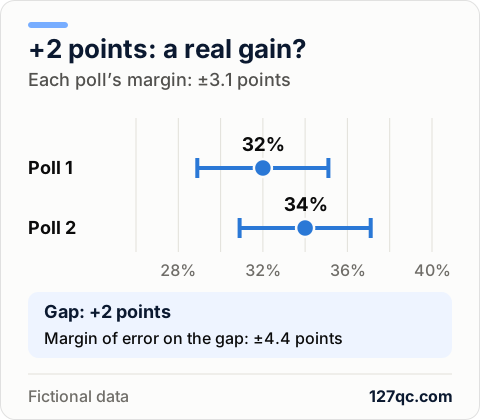
A two-point shift can become a “surge” or a “slump” even when the data do not show any clear movement. François Pétry and Frédérick Bastien documented such exaggerations in coverage of the 2008 federal election. Journalists often repeated the pollsters’ own interpretations.[5]
A meta-analysis by Alon Zoizner covering 32 studies concludes that coverage focused on the horse race and on strategy increases political cynicism on average and reduces knowledge of the substance of issues. It finds no evidence, however, of lower turnout.[6] This research concerns a style of coverage, not only the publication of polls.
The numbers can also affect the morale of party workers and donors. A Library of Parliament analysis described these possible mechanisms as early as 1994.[7] Gains can energize a team; losses can push it to rethink its message.
A probability can seem more certain than it is
In a study published in 2020, Sean Jeremy Westwood and colleagues showed that presenting win probabilities could make a race seem less close than presenting vote shares. In their experimental game simulating an election, probabilities could also lower turnout.[8] This does not show that a projection site lowers turnout in Quebec.
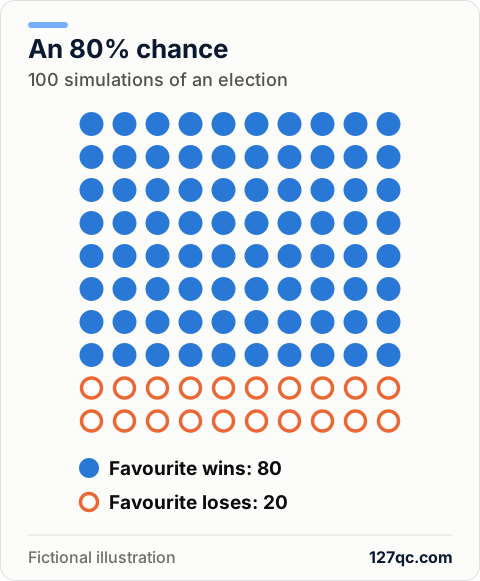
An 80% chance of winning means neither 80% of the vote nor a guaranteed win. In a simulation-based model, the favourite still loses in about one scenario out of five. That share depends on the data and assumptions used; it does not guarantee how often things happen in reality.
Three habits for reading the numbers
Polls also provide useful information: they let us test impressions and talking points against data that can be examined. AAPOR recommends looking at the fieldwork dates, the method, the sponsor and the other surveys available.[12]
When reading a poll or a projection on 127QC, three habits help:
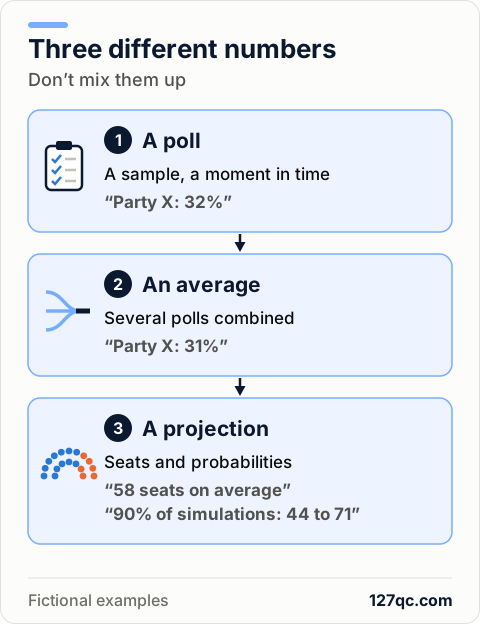
- Identify the number. A poll collects answers; an average combines several polls; a projection turns data into estimates using a model.
- Look at the uncertainty and the trend. A small, isolated change is not enough to establish a reversal.
- Separate the provincial from the local. A party’s standing across Quebec does not sum up its chances in each riding.
Finally, a gap between the polls and the result does not prove that their publication changed the vote. Campaign events, turnout and measurement error can also play a role.
For 127QC, explaining these limits is part of the information we offer readers. The numbers shed light on the balance of power; looking at the platforms, the candidates and the issues remains essential to deciding how to vote.
Sources
- Dahlgaard, J. O., Hansen, J. H., Hansen, K. M. and Larsen, M. V. (2016). How are Voters Influenced by Opinion Polls? The Effect of Polls on Voting Behavior and Party Sympathy. World Political Science, 12(2), 283–300. Experiment on voting intentions and party sympathy.
- McAllister, I. and Studlar, D. T. (1991). Bandwagon, Underdog, or Projection? Opinion Polls and Electoral Choice in Britain, 1979–1987. The Journal of Politics, 53(3), 720–741. Observational study of three British elections.
- Blais, A., Loewen, P. J., Rubenson, D., Stephenson, L. B. and Gidengil, E. (2018). “Information on Party Strength and Strategic Voting: Evidence of Non-Effects from a Randomized Experiment.” In L. B. Stephenson, J. H. Aldrich and A. Blais (eds.), The Many Faces of Strategic Voting: Tactical Behavior in Electoral Systems Around the World, University of Michigan Press, pp. 89–103. Full text, chapter 5. Original study of the 2015 Canadian experiment: voting intentions and votes reported after the election, among people facing a strategic dilemma.
- Daoust, J.-F., Durand, C., Guévremont, M. and Blais, A. (June 8, 2023). Banning pre-election polls is a bad idea. Policy Options, Institute for Research on Public Policy. Opinion piece summarizing Canadian and Quebec research; cited here for the association between following polls and turning out to vote.
- Pétry, F. and Bastien, F. (2013). Follow the Pollsters: Inaccuracies in Media Coverage of the Horse-race during the 2008 Canadian Election. Canadian Journal of Political Science, 46(1), 1–26.
- Zoizner, A. (2021; published online 2018). The Consequences of Strategic News Coverage for Democracy: A Meta-Analysis. Communication Research, 48(1), 3–25.
- Emery, C. (1994). Public Opinion Polling in Canada. Library of Parliament, BP-371E. Historical reference on possible organizational effects; its regulatory information is not used here.
- Westwood, S. J., Messing, S. and Lelkes, Y. (2020). Projecting Confidence: How the Probabilistic Horse Race Confuses and Demobilizes the Public. The Journal of Politics, 82(4). Full manuscript.
- Canada Elections Act, S.C. 2000, c. 9, ss. 326–328; Elections Canada (March 24, 2025), Broadcasting Guidelines, questions 40 to 42. The question wording must accompany results in media other than broadcasting; it always appears in the detailed report. Accessed October 6, 2026.
- Election Act, CQLR, chapter E-3.3, sections 127.25 (pre-election period) and 127.26 (pre-election expense report, due within 150 days after polling day), in force since July 1, 2026 (S.Q. 2025, c. 15). Accessed October 7, 2026.
- Élections Québec (2023). Pour une nouvelle vision de la Loi électorale — Synthèse du chapitre 4 : L’information électorale et politique (in French), p. 5. Consultation document: the proposals it contains are not, in themselves, adopted rules. Accessed October 6, 2026.
- American Association for Public Opinion Research. A Journalist’s Guide to Understanding Polls & Surveys. Accessed October 6, 2026.