572,040 votes, no seats: six paradoxes of Quebec's 2026 election
572,040 votes and no seats for the CAQ: six statistics from 2026 that explain the gap between votes, local victories and elected MNAs.
More than 4.3 million Quebecers cast a ballot on October 5, 2026. Beyond the question of which party finished first, the results reveal striking differences between the votes parties received, the local races they won, and the makeup of the National Assembly.
Here are six revealing numbers from Quebec's first-past-the-post system.
1. More votes than QS — but nine fewer seats
The Coalition avenir Québec received 572,040 votes, compared with 532,114 for Québec solidaire, according to Élections Québec's revised totals. The CAQ therefore collected 39,926 more votes, yet elected no MNAs, compared with nine for QS.
Why? Quebec's 127 seats are not allocated in proportion to the province-wide vote. Each riding elects just one candidate: the person who finishes first. Support spread across many ridings can produce a sizeable vote total without a single local victory.
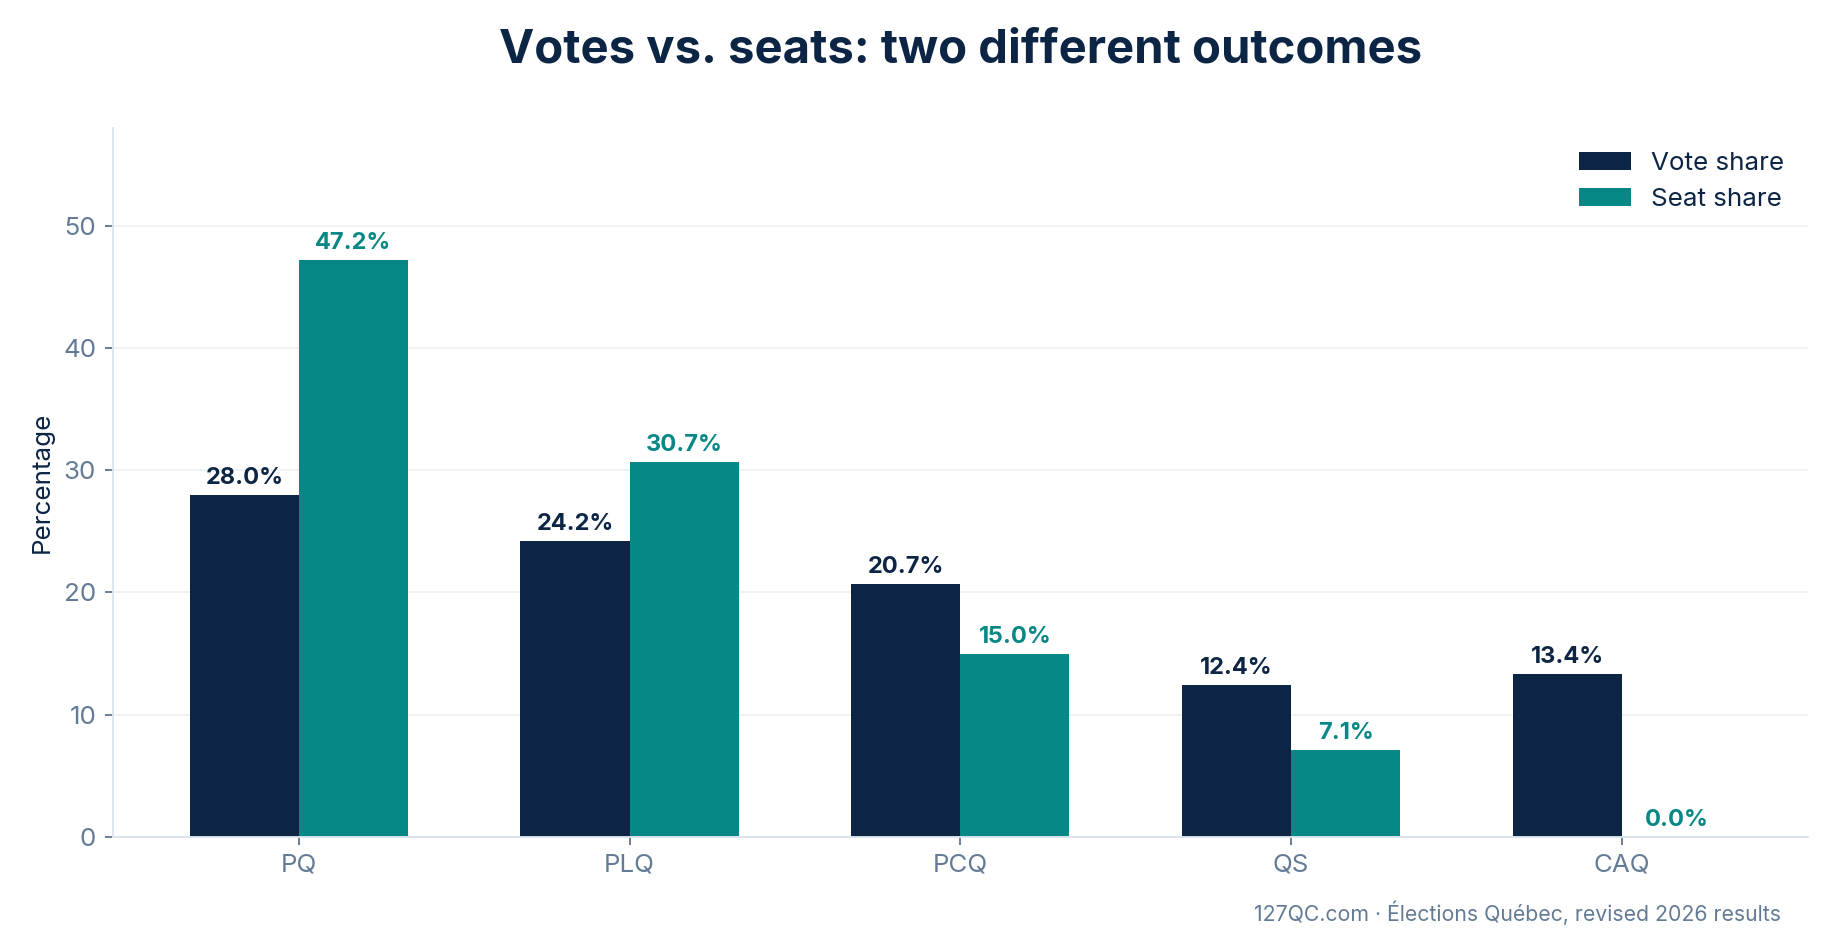
A province-wide percentage summarizes support. It does not determine which candidate wins each riding.
2. The PQ: 28% of the vote, but 47% of the seats
The Parti Québécois earned 28.02% of valid votes. Following the judicial recounts, it holds 60 of 127 seats, or 47.2% of the National Assembly.
The Conservative Party of Quebec received 20.66% of votes, but won 19 seats, representing 15.0% of MNAs.
This is not an error in the tally. It reflects first-past-the-post elections: for the purpose of assigning seats, the result in each riding matters more than the overall provincial total.
3. In 100 ridings, the winner received less than 50%
A candidate can win with 35%, 30%, or even less of the valid vote. The only requirement is to finish ahead of each opponent.
In the revised results, including both judicial recounts, 100 of 127 elected candidates received less than 50% of the valid votes. Eight were elected with less than 30%.
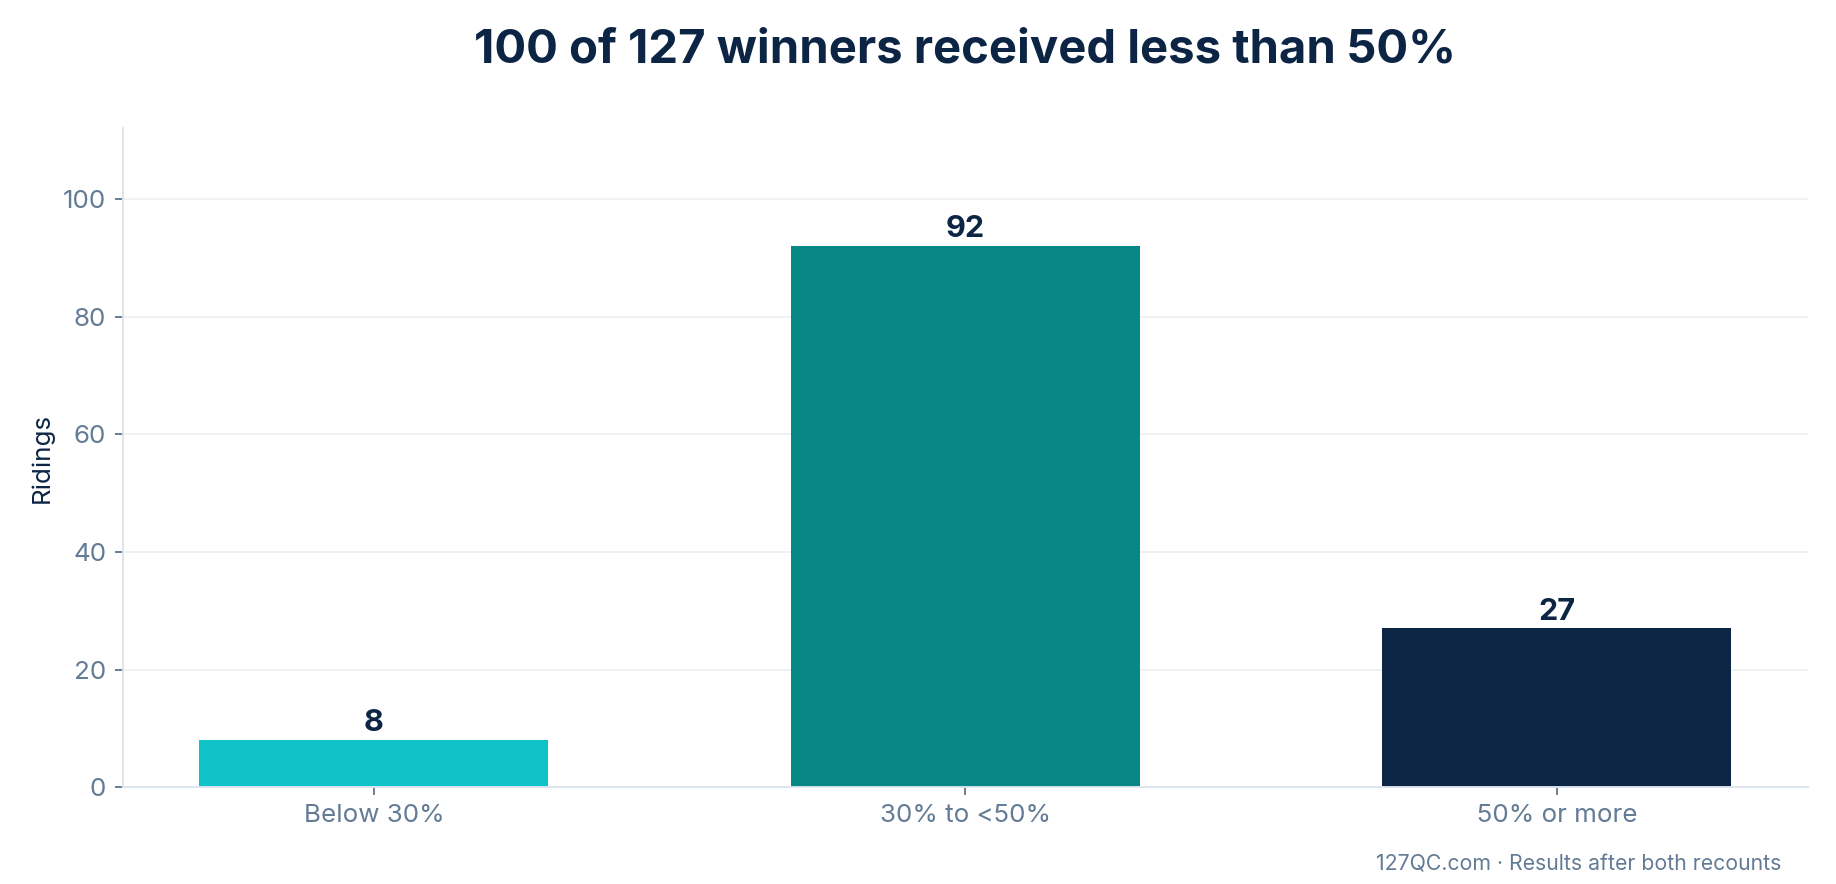
In Saint-François, the successful PQ candidate received 26.03% of the vote. In Jacques-Cartier, the elected Liberal candidate took 73.2%. Each earned one seat, despite the enormous difference in their winning vote shares.
Votes for the other candidates still count as votes expressed. But they do not give their preferred party a seat in that riding.
4. Almost 2.5 million votes went to unsuccessful candidates
Adding up the votes for all 127 elected candidates, after the recounts, gives 1,787,816 votes. Unsuccessful candidates received 2,496,542 votes — 58.3% of all valid votes.
This shows how widely the provincial vote can diverge from the distribution of seats. It does not mean those votes were discarded, invalidated, or worthless. They were all counted. They simply did not directly elect a local representative.
This is a measure of votes cast for unsuccessful candidates, not a measure of the democratic value of individual voters.
Judicial recounts: a reversal in Vachon, no change in Champlain
In Champlain, a judicial recount confirmed the election of Adriana Szalontai (PCQ). Her lead over René Branchaud (PQ) narrowed from 191 to 186 votes. In Vachon, the recount changed the winner: Stephan Fogaing (PQ) won by three votes over Affine Lwalalika (QLP).
The statistics in this article reflect both recounts.
5. Province-wide votes per elected MNA: a revealing ratio
One way to illustrate how votes translate into seats is to divide each party's province-wide votes by its number of elected MNAs. This is not the actual number of votes required to win an individual riding.
| Party | Province-wide votes (revised) | Elected MNAs | Votes per elected MNA |
|---|---|---|---|
| PQ | 1,200,369 | 60 | 20,006 |
| QLP | 1,037,953 | 39 | 26,614 |
| PCQ | 885,337 | 19 | 46,597 |
| QS | 532,114 | 9 | 59,124 |
| CAQ | 572,040 | 0 | No ratio |
The contrast between 20,006 votes per PQ MNA and 59,124 per QS MNA is striking. Still, no PQ candidate was elected with all of their party's provincial votes. This ratio illustrates conversion into seats, not the voting threshold for an individual victory.
6. The political map changed completely in four years
In 2022, the CAQ won 90 seats, the PQ three, the Liberals 21, and Québec solidaire 11. The PCQ elected no MNAs.
By 2026, the picture had been transformed: 60 PQ, 39 QLP, 19 PCQ, nine QS, and zero CAQ seats.
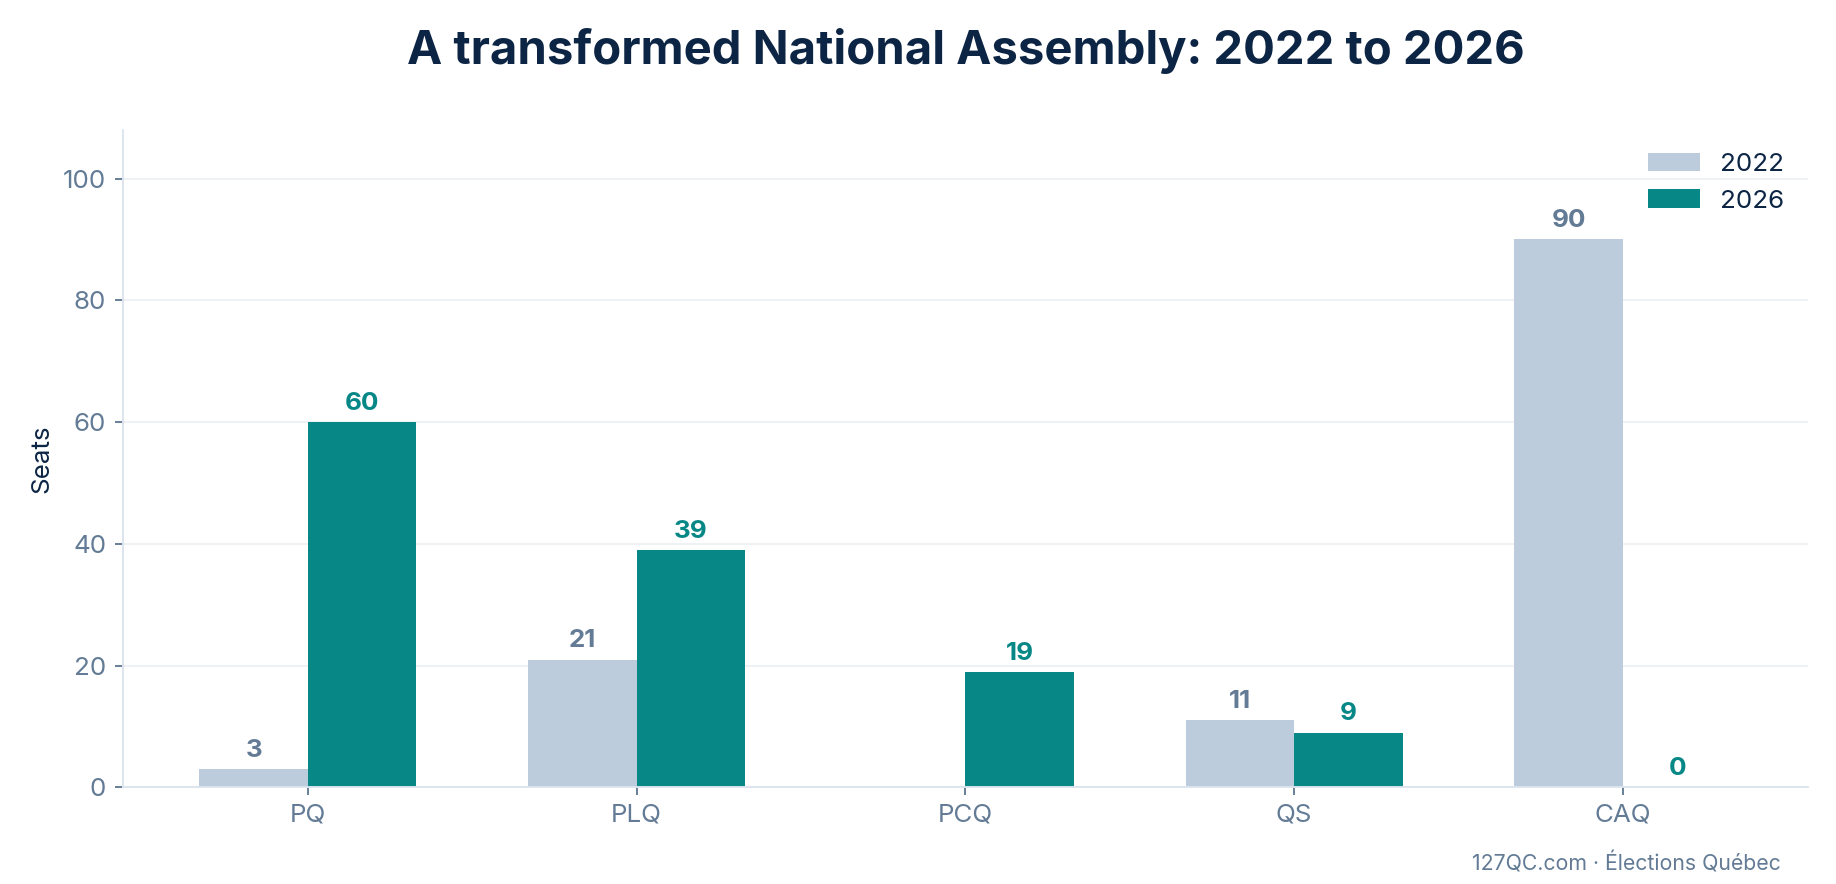
Quebec went from 125 to 127 ridings between the two elections. That change alone cannot account for such a dramatic political shift. Changing voter support — and where that support is concentrated — is what matters.
What these numbers tell us
The popular vote and the National Assembly answer different questions. The former tells us how many people supported each party; the latter tells us who won each individual riding.
That is how a party can win hundreds of thousands of votes without a seat, or a candidate can win a seat with barely more than one-quarter of the local vote.
In Quebec, the number of votes a party receives is not the only thing that matters for seats. Where those votes are cast matters too.
For more, explore 127QC's assessment of its final election projection.
Sources and method
- Élections Québec — 2026 general election results : revised vote totals and seats.
- Élections Québec — past election seat distributions : 2022 comparison.
- Élections Québec — judicial recount in Vachon : three-vote PQ victory.
- Élections Québec — judicial recount in Champlain : winner unchanged, final margin of 186 votes.
- The figures of 100 winners below 50%, eight below 30%, 1,787,816 votes for elected candidates, and 2,496,542 for unsuccessful candidates are calculated from the revised results including both recounts.
Text and charts: 127QC.com.