Which poll best measured Quebec’s 2026 election? We tested them one by one.
Does the most accurate poll on provincial vote shares also identify the most riding winners? We reran the numbers for all 127 ridings.
In the final days before the October 5 election, polling firms released their last voting-intention estimates. Now that the results are known, we can compare those numbers with what happened.
But there are two ways to measure accuracy: by comparing provincial vote shares or by counting how many riding winners the model identified correctly.
1. Forum Research: closest to the provincial vote
Among the final polls compared, Forum Research had the lowest average error: 0.81 percentage points across the five main parties. Léger followed at 0.90 points, with Pallas Data at 0.92 points.
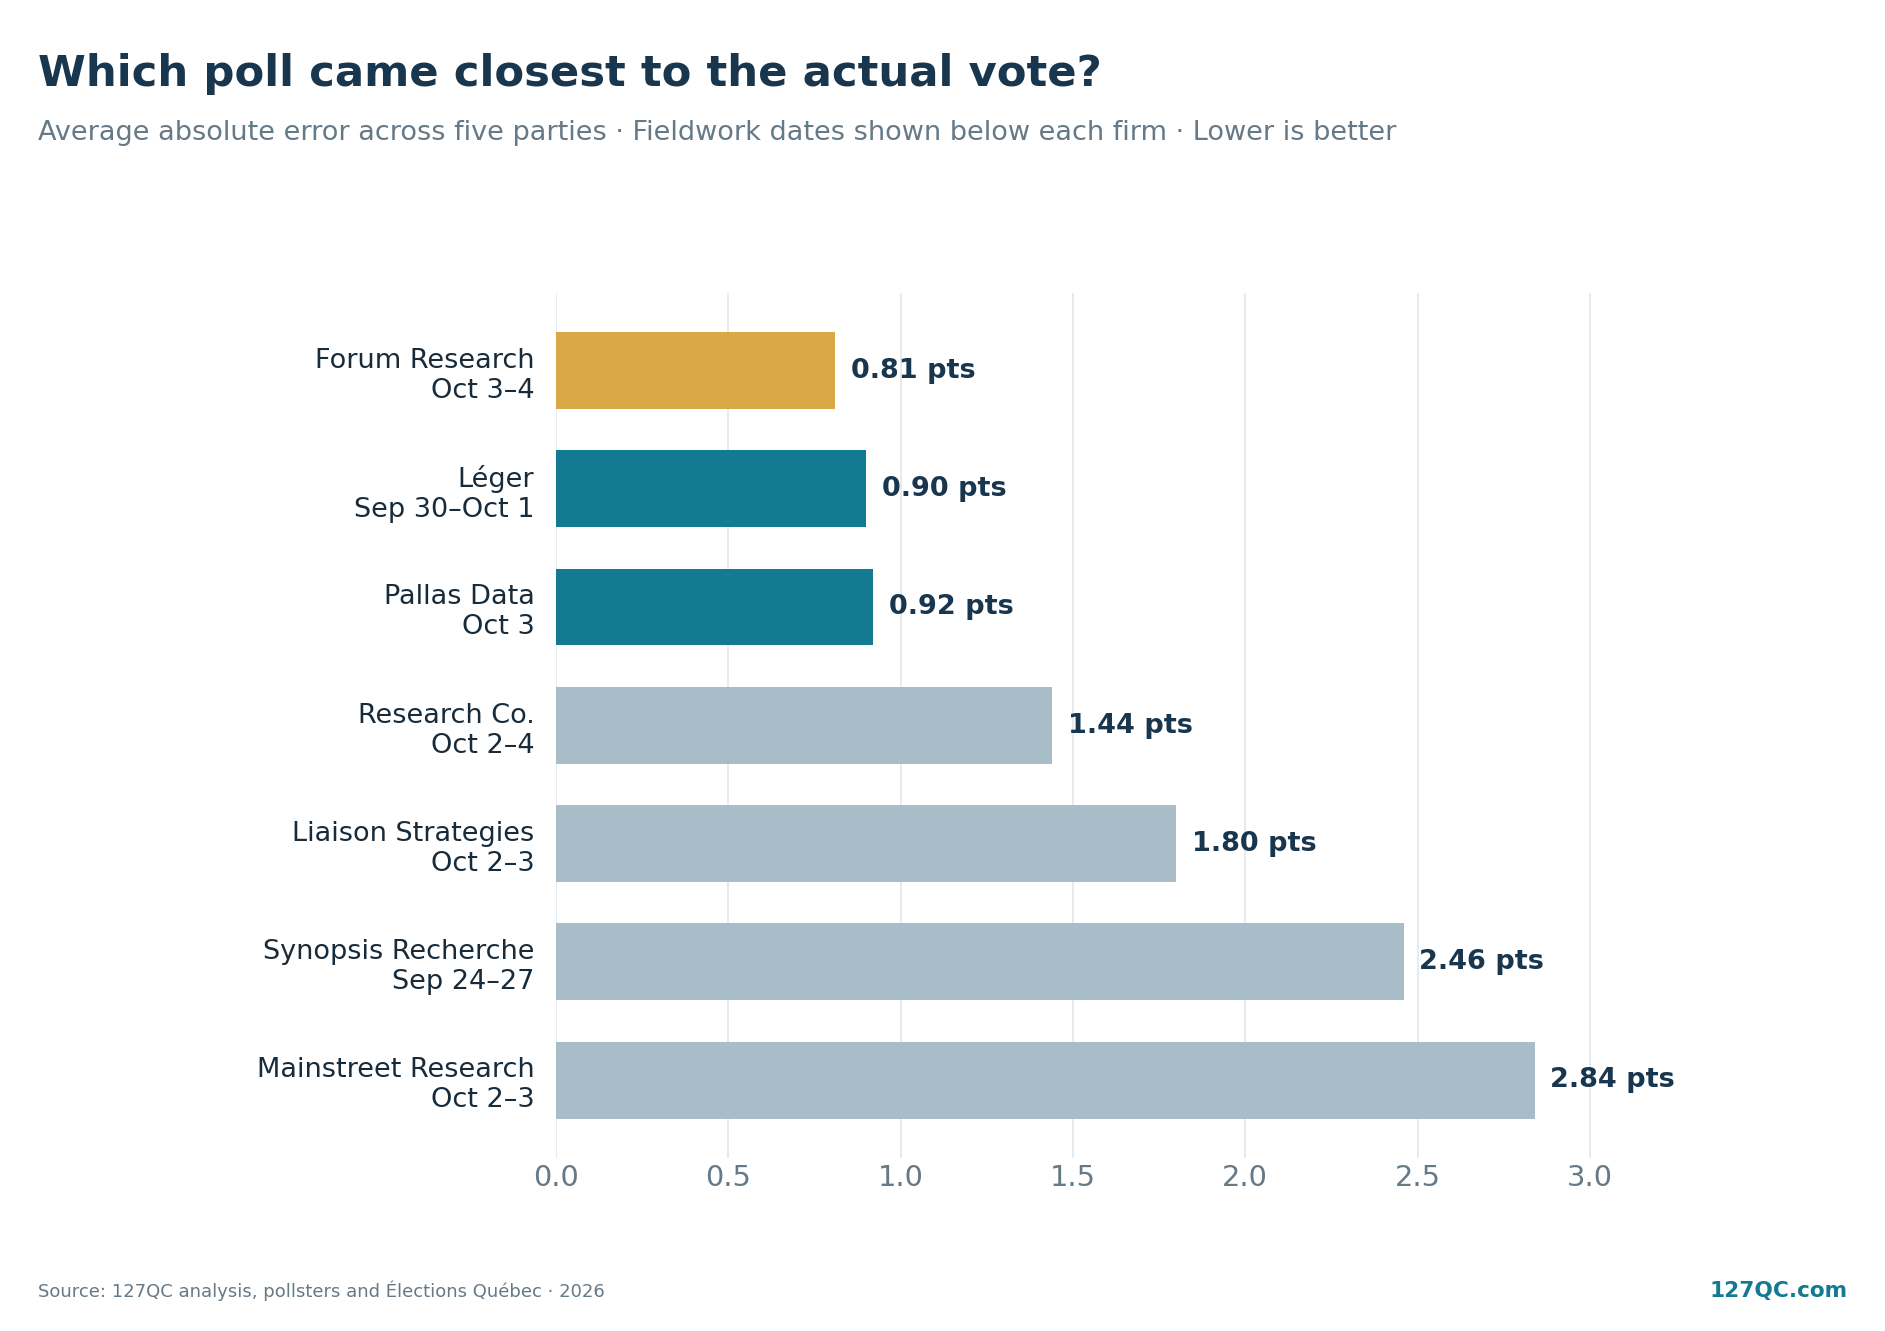
Forum conducted its survey on October 3–4, but it was published on October 5, after 127QC had frozen its final projection on October 4. It was therefore unavailable for our published forecast.
2. With Pallas, the 127QC model identified 119 of 127 riding winners
For this test, we replaced the provincial polling average with one poll at a time, while keeping the 127QC model, historical results and regional adjustments unchanged.
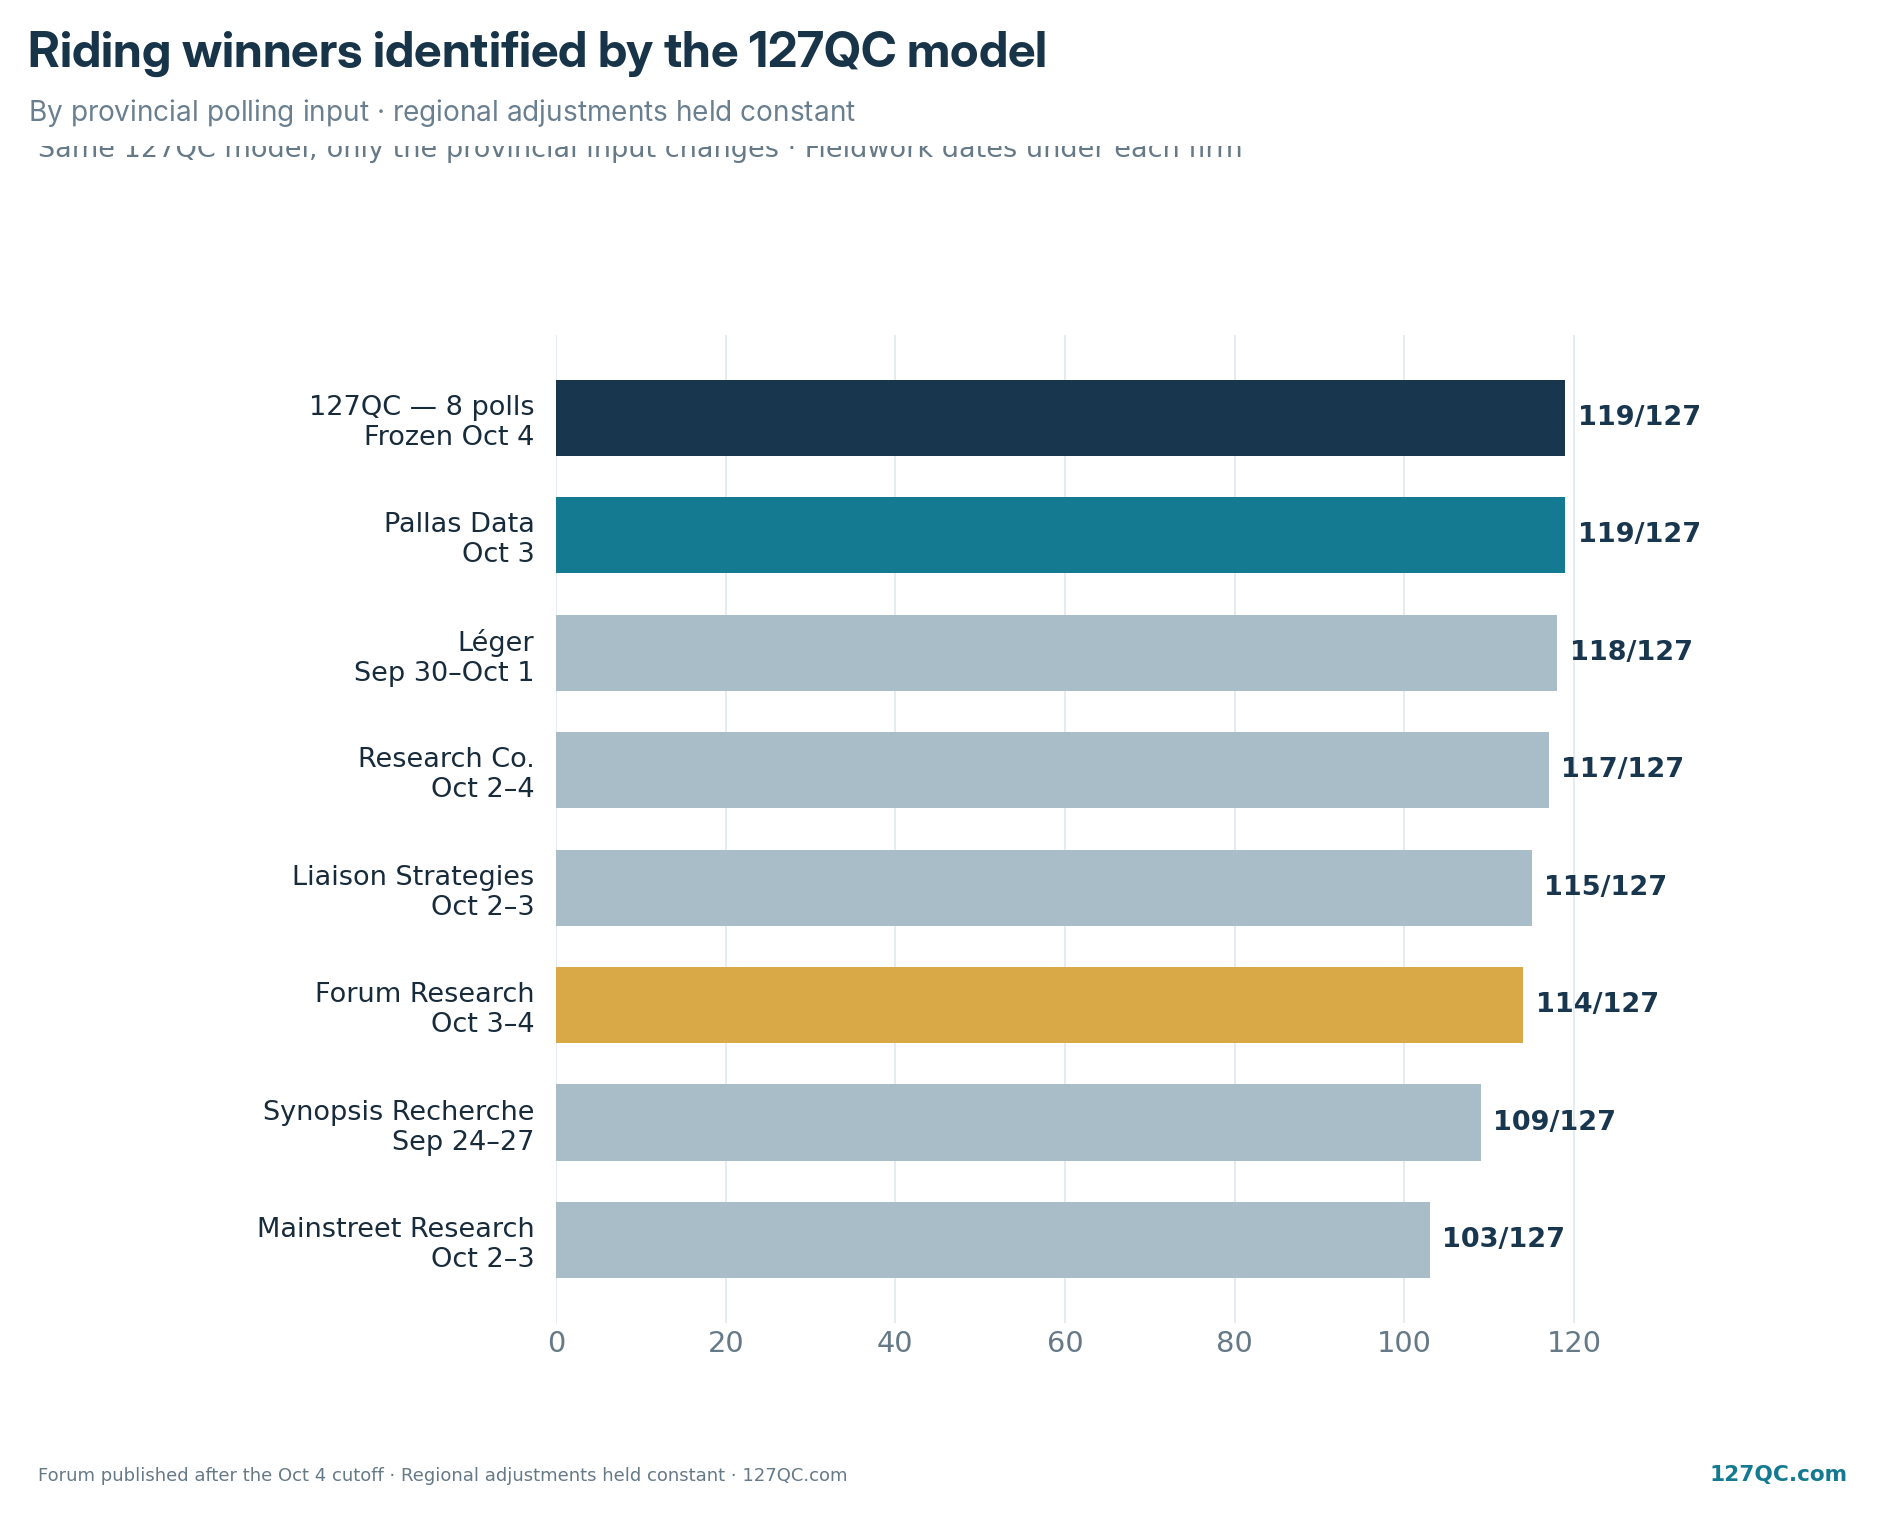
With the Pallas poll (conducted October 3 and published October 4) as its provincial input, our 127QC model would have identified 119 of 127 riding winners, matching its final eight-poll average. With Léger’s provincial data, it would have identified 118; with Forum’s, 114. These are calculations made by 127QC, not seat forecasts published by the polling firms.
3. Dates and results: the complete comparison
Note: the correct-ridings column reports results produced by the 127QC model with each provincial poll as input—not forecasts published by those pollsters.
| Pollster | Fieldwork | Published | Vote error | 127QC correct / 127 |
|---|---|---|---|---|
| Pallas Data | FieldworkOct 3 | PublishedOct 4 | Vote error0.92 pt | 127QC correct / 127119 |
| Léger | FieldworkSep 30–Oct 1 | PublishedOct 3 | Vote error0.90 pt | 127QC correct / 127118 |
| Research Co. | FieldworkOct 2–4 | PublishedOct 4 | Vote error1.44 pt | 127QC correct / 127117 |
| Liaison Strategies | FieldworkOct 2–3 | PublishedOct 4 | Vote error1.80 pt | 127QC correct / 127115 |
| Forum Research* | FieldworkOct 3–4 | PublishedOct 5 | Vote error0.81 pt | 127QC correct / 127114 |
| Synopsis Recherche | FieldworkSep 24–27 | PublishedSep 27 | Vote error2.46 pts | 127QC correct / 127109 |
| Mainstreet Research | FieldworkOct 2–3 | PublishedOct 4 | Vote error2.84 pts | 127QC correct / 127103 |
| Segma Recherche | FieldworkSep 8–17 | PublishedSep 21 | Vote error3.59 pts | 127QC correct / 127103 |
| Nanos Research | FieldworkSep 12–14 | PublishedSep 16 | Vote error3.39 pts | 127QC correct / 127100 |
*Forum was not included in 127QC’s October 4 final projection. All other polls in the table were archived in that projection. All dates refer to 2026.
Older polls interviewed people earlier in the campaign, so differences cannot be attributed entirely to the quality of the polling firms.
4. Why does the ranking change when we look at seats?
Voters do not behave the same way in every part of Quebec. To translate vote shares into seats, the 127QC model takes previous election results and regional adjustments into account.
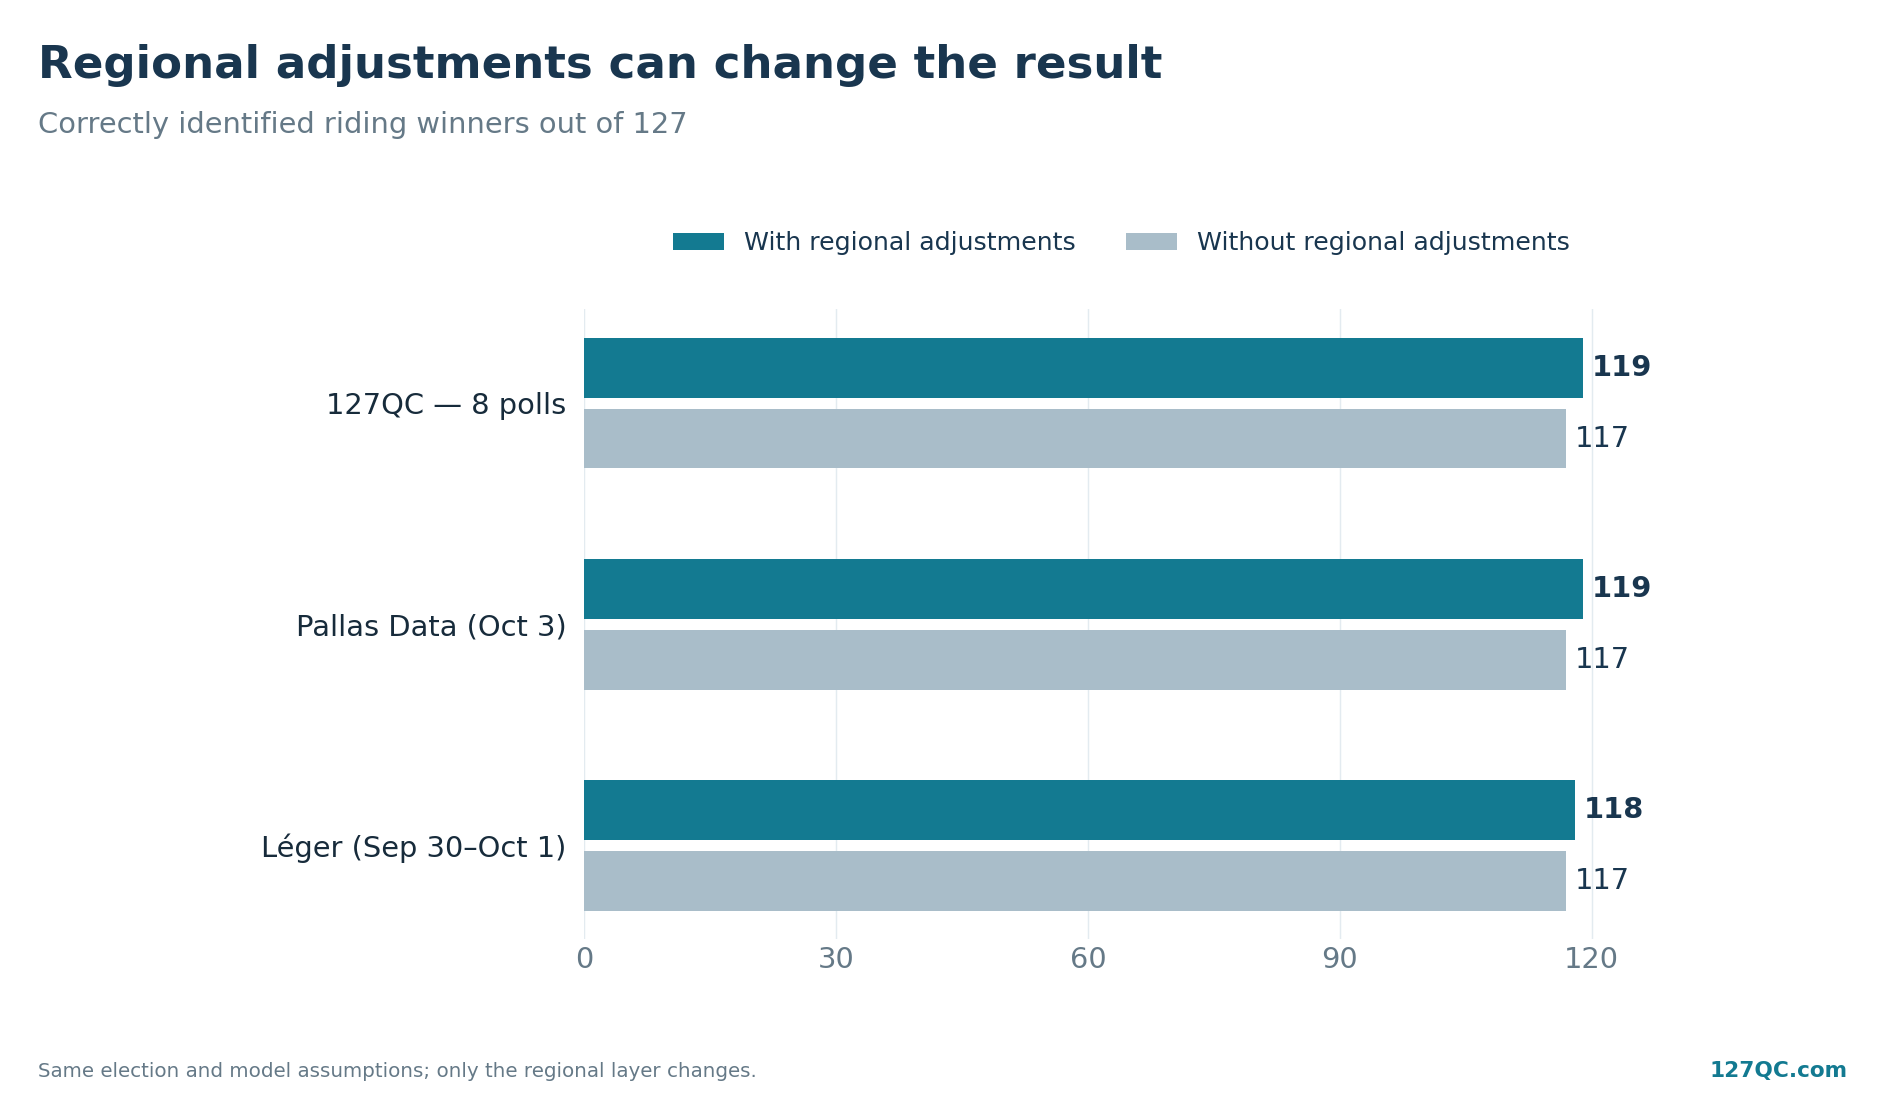
An important qualification: our “single poll” tests kept 127QC’s regional layer, which drew in part on Léger’s regional data. This is not a fully independent comparison of the polling firms.
Should we have used only Pallas?
Not necessarily. With Pallas as its provincial input, the 127QC model would have matched its eight-poll result in 2026. But selecting a firm after seeing the results is not a reliable strategy for the next election.
The main lesson is that measuring provincial vote shares and projecting their distribution across ridings are two different tasks. That is why 127QC will keep evaluating both the polls and the method used to convert votes into seats.
Method: retrospective tests using the central 127QC projection frozen on October 4, 2026. Only the provincial poll input was replaced. All other parameters, including regional adjustments, were held constant. All riding-winner scores were calculated by the 127QC model, not published as seat forecasts by the polling firms. They refer to the central projection, not the 5,000 probabilistic simulations. Provincial poll errors are average absolute differences across the five main parties.
Sources
- 127QC election-projection archives.
- Élections Québec.
- Forum Research.
- Original publications of the polling firms compared.